Figure 7.
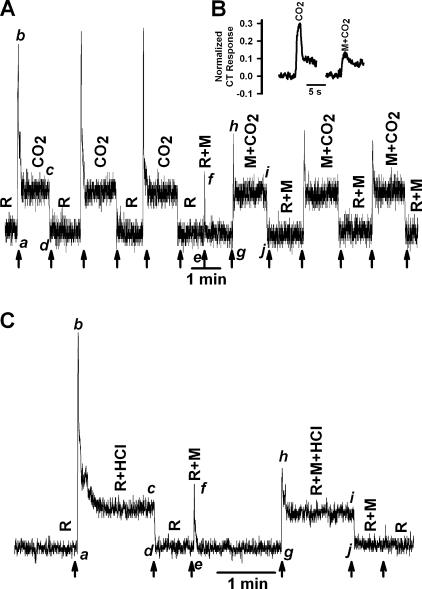
Effect of hypertonic mannitol on the CT response to CO2 and HCl. (A) The CT responses to dissolved CO2 (72 mM KHCO3 + 10%/90% CO2/O2; pH 7.4) were recorded relative to the rinse solution, R (72 mM KCl + 10 mM HEPES; pH 7.4). In the second part of the experiment the CT responses were recorded with both rinse (R+M) and the CO2 solution (M+CO2) containing, in addition, 1 M mannitol (M). (B) Inset shows a set of transient phasic responses to CO2 stimulation in the presence and absence of mannitol in an extended time scale. The magnitude of the peak phasic response was normalized to the phasic response elicited by stimulation with 300 mM NH4Cl. (C) The CT responses to 20 mM HCl + 10 mM KCl (R+HCl) were recorded relative to the rinse solution, R (10 mM KCl). In the second part of the experiment the CT responses were recorded with both rinse (R+M) and the HCl solution (R+M+HCl) containing, in addition, 1 M mannitol (M). The arrows indicate the time when the tongue was superfused with different solutions.

