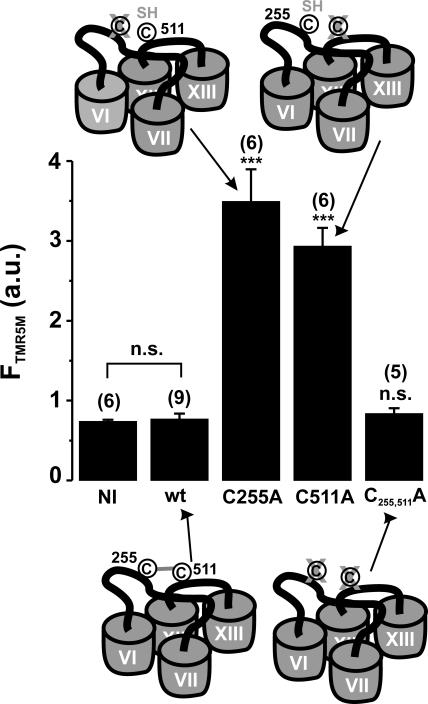
Figure 10.
Fluorescent labeling of oocytes expressing mutants C255A, C511A, and C255,511A as compared with wt SGLT1. See MATERIALS AND METHODS for the procedure of fluorescent labeling with the TMR5M fluorescent probe. The fluorescence signal is indicated in arbitrary units (a.u.). NI indicates noninjected oocytes. The number of oocytes used per sample is indicated in parentheses. A cartoon shows the availability of cysteine residues in each situation. Stars indicate the statistical significance for unpaired Student's t test against wt SGLT1 data (see Fig 5 legend). Errors are SEM.

