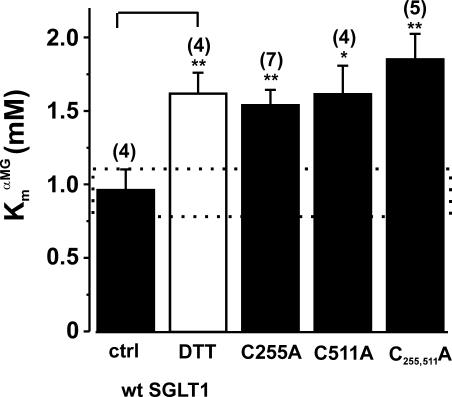
Figure 8.
Apparent affinity for αMG (Km α MG) for oocytes expressing mutants C255A, C511A, and C255,511A compared with wt SGLT1, with and without DTT. The application of DTT to wt SGLT1 was performed as described in MATERIALS AND METHODS (paired experiments). The affinity was assessed with data measured at −150 mV. The dotted box represents the interval for which the Km α MG of a mutant would not be significantly different from that of wt SGLT1. The number of individual oocytes used per value is indicated in parentheses. Errors are SEM. Stars indicate the statistical significance (see Fig 5 legend).

