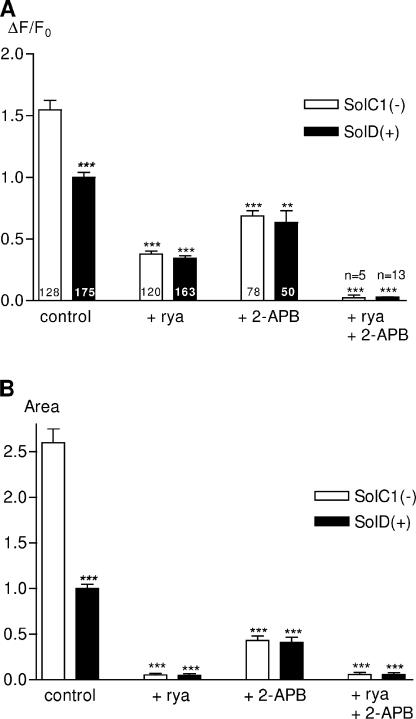
Figure 2.
Amplitude and “area under the curve” parameters from K+-evoked calcium increases in Sol cell lines: effects of ryanodine and 2-APB. Large-scale analysis of K+-evoked fluorescence rises has been realized to compare them in the two myotube types and in the presence of SR Ca2+ channel inhibitors. All these parameters were represented in histograms as relative values to control conditions in SolD(+) set at 1.0. Parameters have been automatically measured with a computer program developed under IDL 5.3 (Fig. 3, inset). (A) Histogram representing the rise amplitude (ΔF/F0) in SolC1(−) (white bars) and SolD(+) (black bars) in controls and with inhibitors (same incubation conditions as in Fig. 1). The number of analyzed myotubes is given in histogram bars. (B) Histogram representing the “area under the curve” parameter measured on curves obtained in SolC1(−) (white bars) and SolD(+) (black bars). Each bar graph corresponds to the mean value ± SEM obtained for each type of myotube. ns, not significantly different. ***, P < 0.001; **, 0.001 ≤ P < 0.01; *, 0.01 ≤ P < 0.05 (Student's unpaired t test).

