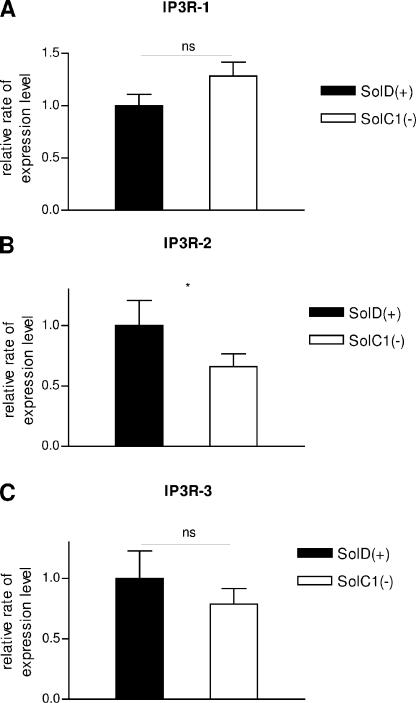
Figure 4.
Expression of IP3Rs in SolC1(−) and SolD(+) myotubes. RT-PCR–based analysis of IP3R-1 (A), IP3R-2 (B), and IP3R-3 (C) mRNA for 40 cycles. S6 ribosomal mRNA was used as an internal standard. Relative mRNA expression levels of IP3R-1, IP3R-2, and IP3R-3 was compared with S6 ribosomal mRNA expression. Expression of IP3R isoforms in SolC1(−) myotubes were compared with normalized SolD(+) one. Each bar graph corresponds to the mean value ± SEM obtained for n = 4 (n number of experiments). ns, not significantly different. ***, P < 0,001; **, 0.001 ≤ P < 0.01; *, 0.01 ≤ P < 0.05 (Student's unpaired t test).

