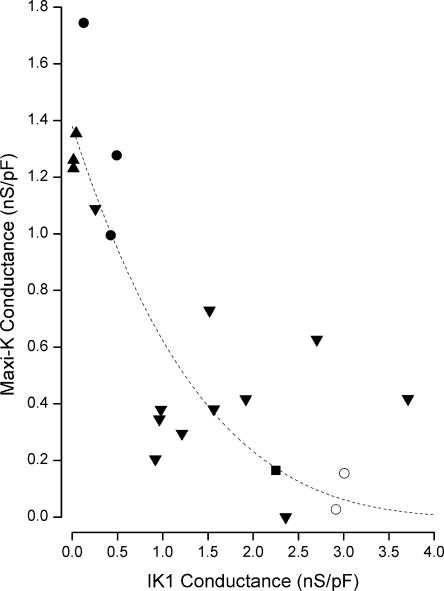
Figure 2.
Reciprocal activity of maxi-K and IK1 channels. Maxi-K conductance (at +50 mV) as a function of IK1 conductance (at −110 mV) obtained from cells patched with 80 (▴), 160 (•), 250 (▾), and 400 nM Ca2+ (▪) and 250 Ca2+ with 2–10 μM DCEBIO (◯). Each data point represents a separate cell. Line: Eq. 1 with G0, a, and n values of 1.4 nS/pF, 0.18, and 4, respectively.

