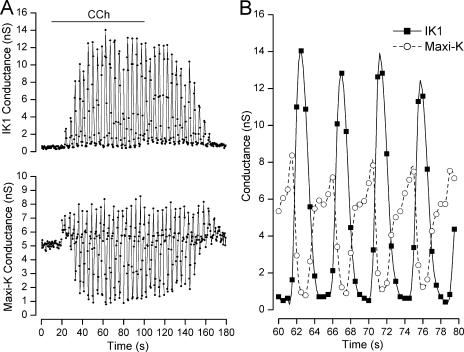
Figure 3.
Carbachol-induced maxi-K and IK1 channel activity in perforated patch experiments. (A) IK1 (top) and maxi-K (bottom) channel conductances at −100 and +30 mV, respectively, before, during, and after application of 20 μM CCh as indicated. (B) A 20-s expanded temporal view of the IK1 (▪) and maxi-K (◯) conductances from the data in A. Data points connected by spline functions.

