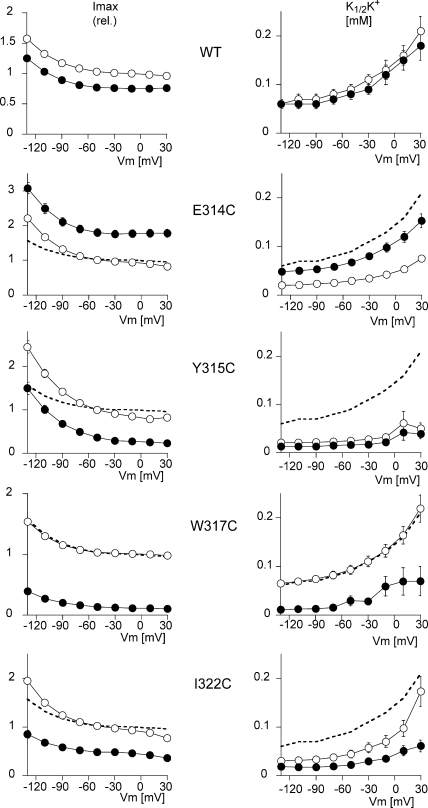
Figure 5.
Effect of MTSET on the voltage-dependent kinetics of activation by extracellular K+ in a Na+-free solution. The K+ concentration was increased in steps from 0 to 0.05, 0.1, 0.2, and 5 mM. MTSET was added at a concentration of 250 μM to the 5 mM K+ solution, and after a 2-min exposure, the K+-induced current was measured again by exposure to the same external K+ concentrations. I-V curves were recorded for each K+ concentration. The values of the K+-induced current at each concentration were used to calculate the maximum K+-induced current (Imax), and the K+ activation constant (K1/2K+), as described in MATERIALS AND METHODS. The K1/2K+ values were obtained by recording I-V curves in increasing K+ concentrations before and after exposure to MTSET. The five plots on the left represent the Imax and the five plots on the right represent the K1/2K+ as a function of the membrane potential for the WT (n = 10) and for four cysteine mutants, E314C (n = 12), Y315C (n = 9), W317C (n = 10), and I322C (n = 11). The curves with open symbols represent the measurements before MTSET perfusion, and those with the filled symbols represent the measurements after exposure to MTSET. The mean values measured in WT before MTSET treatment (open symbols in the top plot) are shown as a thick dashed line (without symbols or error bars) in the plots for each mutant for comparison. Error bars represent SEM. The error bars are smaller than the symbol size in some cases.

