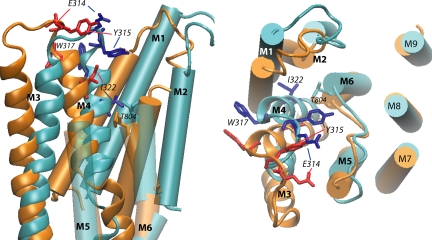
Figure 7.
Structural model of the E1 and E2 states of the Na,K-ATPase built by homology with the 1SU4 and 1WPG structures of SERCA, respectively. The conformation of the loop was selected from among 500 conformers generated after clustering and effective energy calculation as detailed in MATERIALS AND METHODS section. The superposition was done on the fixed part of the TM domains between all the conformers. The distance between the helices in a given structure was calculated. We define one helix as being fixed relative to another if the distance considered is equal in all the structures (≤1.5 Å difference). Transmembrane segments (M1–M9) are indicated (in blue for E1 and in orange for E2). The M3–M4 hairpin is represented as thick ribbon representation with the side chains of the four residues studied in details (E1 dark blue, E2 red). The panel on the left shows a view parallel to the membrane plane (extracellular side up) from the position of the transmembrane segments M7–M10, which have been removed for clarity. The M5–M6 loop is transparent and its extracellular part has been removed for clarity. The large outward movement of I322 from the E1 to the E2 conformation can be observed. The panel on the right shows a view from the extracellular side of the membrane; the large movements of E314, Y315, and W317 from the E1 to the E2 conformation can be observed. The large extracellular loop between M7 and M8 has been removed. The side chain of residue T804, at the top of segment M6, is shown.

