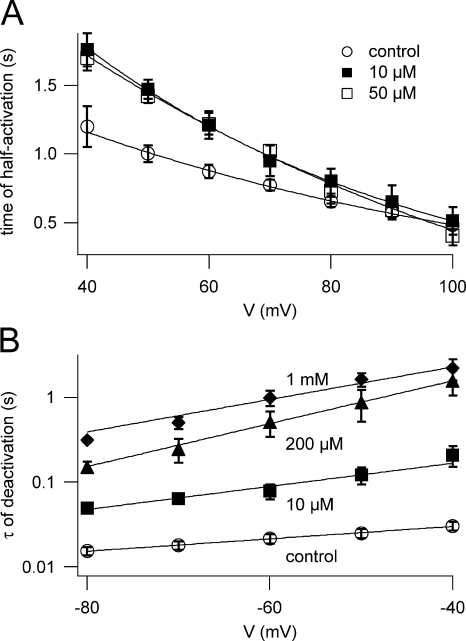
Figure 3.
Neomycin slows down both activation and deactivation of macroscopic SV currents. (A) Time required for current half activation is plotted against the applied membrane potential. Data points represent mean values (± SEM) determined in control conditions (open circles; n = 9), in the presence of 10 μM (closed squares; n = 5) and 50 μM neomycin (open squares; n = 4). Lines are best fits to a monoexponential function. The increase of activation time saturated already at 10 μM neomycin; consequently, values for 200 μM are not given for clarity, but were comparable and overimpose to 10 and 50 μM. (B) Time constants of current deactivation τ are plotted against the tail potential. Data points represent mean values (± SEM) of τ determined in control conditions (open circles; n = 9) and in the presence of 10 μM (closed squares; n = 5), 200 μM (closed triangles; n = 4), and 1 mM neomycin (closed diamonds; n = 3). Lines are best fits to a monoexponential function.

