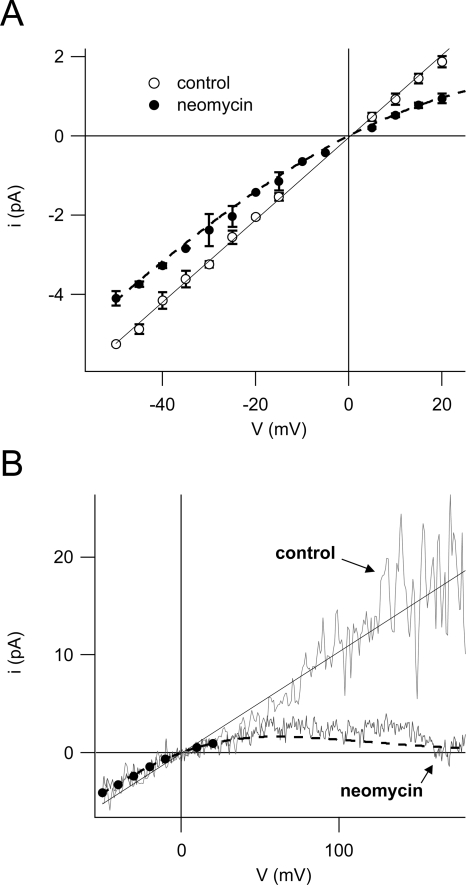
Figure 7.
SV channels are completely blocked by neomycin at high positive membrane potentials. (A) Single channel current–voltage relationship in control conditions (open circles) and in the presence of 50 μM neomycin (filled circles) derived from continuous traces for positive potentials (e.g., Fig. 6 A) and from deactivation tails for negative potentials (e.g., Fig. 6 C) of two to four experiments (error bars represent SD). Data points of control were fitted with a linear function (black line) yielding a unitary conductance of 104 ± 1 pS. (B) Individual single channel current–voltage relationships in control (light gray trace) and 50 μM neomycin (dark gray trace) obtained from a cytosolic side-out excised patch. Traces were superimposed with data points for neomycin (filled circles) and the linear fit for control (both from A). Dashed lines in A and B are the graphical representation of the function predicting single channel currents in the presence of 50 μM neomycin on the basis of fit parameters derived from dose–response analyses of macroscopic currents (Fig. 5). See text for details.

