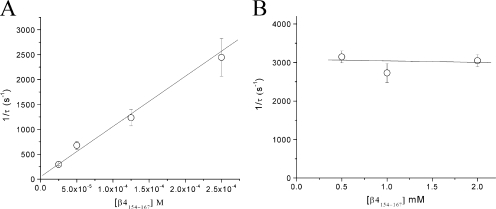
Figure 2.
On and off rates of β4154–167 binding at 50 mV. (A) The τ values were recorded in inactivation-deficient hNav1.5-CW mutant channels at β4154–167 concentrations ranging from 25 to 250 μM, inverted, and plotted against the corresponding concentration (n = 5). The plot was fitted by a linear regression to yield y = 49.1 + (10.1 × 10⁶) × x. Off rate (k-1 = x intercept) was estimated to be 49.1 s−1, and the on rate (k1 = slope) was 10.1 [μM]−1s−1. (B) The τ values were recorded at β4154–167 concentrations ranging from 0.5 to 2 mM, inverted, and plotted against the corresponding concentration. The τ values did not vary significantly at this concentration range (P > 0.05; n = 6). Error bars represent SEM.

