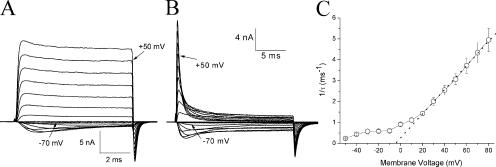
Figure 3.
Time-dependent block at various voltages. Families of superimposed hNav1.5-CW current traces were recorded at various voltages in the absence (A) and presence (B) of 125 μM β4154–167. Traces corresponding to −70 and 50 mV are labeled. For the steady-state block of β4154–167, a slower time frame was used in B, which was recorded ∼30 min after the pipette break-in. (C) The decaying phase of the current traces at 1 mM β4154–167 was fitted by a single exponential function with a time constant, τ. The τ value was inverted and plotted against the corresponding voltage (n = 6 except at −10 mV, where n = 3). Error bars represent SEM.

