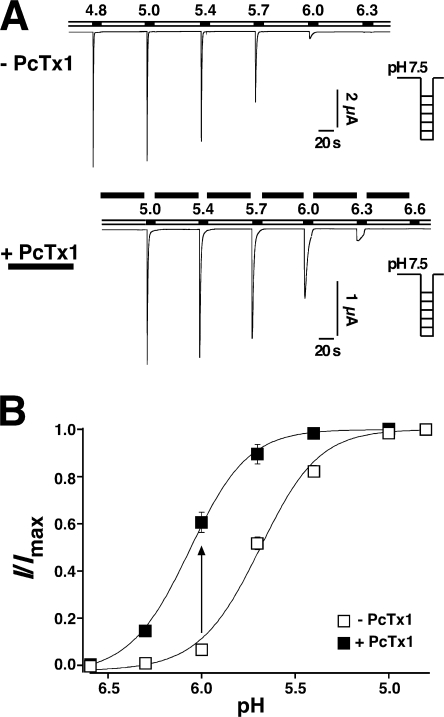
Figure 2.
PcTx1 facilitated opening of ASIC1b. (A) Representative current traces elicited by pH ranging from 4.8 to 6.6 with conditioning pH 7.5 (applied for 60 s). Top, without PcTx1; bottom, with 100 nM PcTx1. (B) H+ dependence of ASIC1b activation in the absence (n = 7, open squares) or in the presence (n = 6, filled squares) of 100 nM PcTx1. Solid lines are fits of the mean values of each data point to a Hill function (Eq. 1). PcTx1 significantly (P < 0.01) shifted the pH activation curve to lower H+ concentrations. The arrow illustrates how PcTx1 potentiates currents at pH 6.0, as shown in Fig. 3 A.

