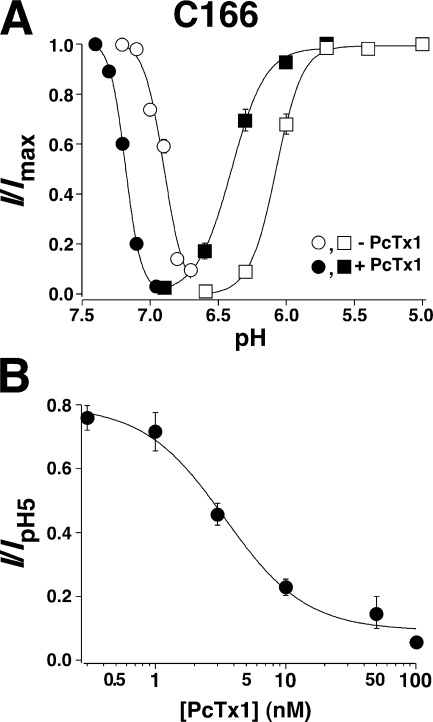
Figure 8.
(A) PcTx1 robustly shifted the steady-state desensitization and activation curves of C166. pH50 of activation was pH 6.07 ± 0.05 (n = 7) in the absence of PcTx1 (open squares) and pH 6.40 ± 0.06 n = 5, in the presence of 100 nM PcTx1 (closed squares). pH50 of steady-state desensitization was pH 6.90 ± 0.01 (n = 5) in the absence of PcTx1 (open circles) and pH 7.17 ± 0.01 (n = 5) in the presence of 100 nM PcTx1 (closed circles). Solid lines are fits of the mean values of each data point to the Hill function (Eq. 1).(B) Concentration–response relationship for inhibition of C166 currents by PcTx1. Different concentrations of the toxin were applied for 120 s during the conditioning period with pH 7.1. The line represents a fit to the Hill equation (IC50 = 3.4 nM; n = 8–10).

