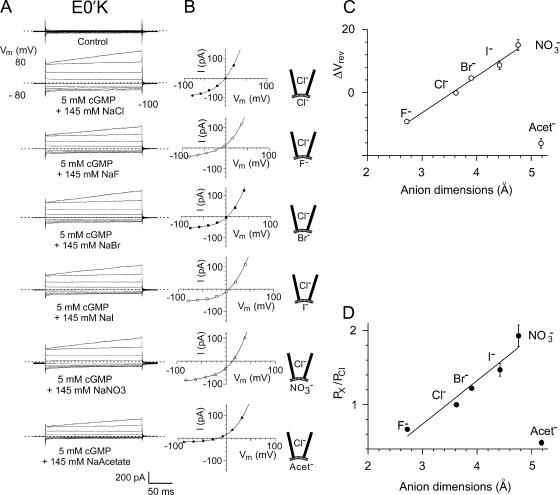
Figure 7.
The current–voltage relationships and relative anion selectivity of the E0′K (E342K) CNGA2 channels in bi-ionic solutions with Cl− ion substitutions by other halide, NO3 −, and acetate− anions. (A) Macroscopic cGMP-activated currents in different bi-ionic solutions in one inside-out patch with mutant E0′K CNGA2 channels. Note that in this particular recording the currents were unusually large. For each set of currents, the cytoplasmic NaCl control solution is replaced by NaF, NaBr, NaI, NaNO3, and NaAcetate. (B) Current–voltage curves for the currents shown in A. In each case the average control currents in the absence of cGMP have been subtracted, as in the procedures used for Figs. 3–5 . Again, the zero current level is shown by the short-dashed line for each set of traces. The membrane potential, Vm, values have all been corrected for liquid junction potentials. A negative shift for ΔVrev indicates that the anion is less permeant than Cl− and a positive shift that it is more permeant. The reversal potentials (in mV) for this one patch were as follows: Cl− (−0.5), F− (−11), Br− (3.5), I− (5.5), NO3 − (13), and acetate− (−18). C and D give the average data for all the recordings from the E0′K anion selectivity experiments and show the shifts in reversal potential (C) and relative permeabilities (D) of the anions as a function of anion size (calculated using the GHK equation; Eq. 3). D shows for the halides and NO3 − that as the dimensions of the anion increases (and magnitude of the hydration energy decreases), its relative permeability decreases. However, the larger acetate− has a much lower relative permeability than the larger halides and NO3 −, suggesting a different interaction with the channel. For the halides, the anion dimension is taken as the diameter, and for the nonspherical NO3 − and acetate− ions, the median dimension is used. The mean values for relative anion permeabilities in all the mutant E0′K patches are given in Table II.

