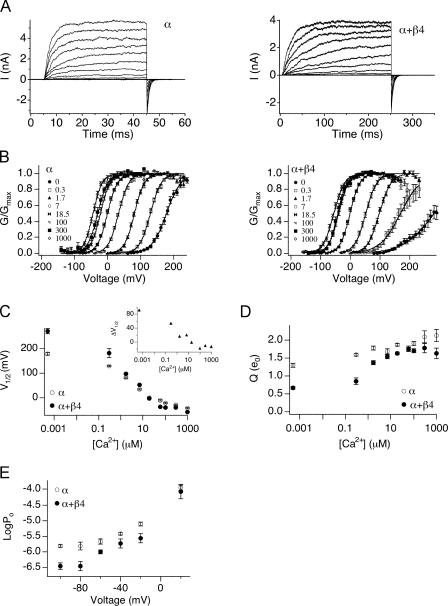
Figure 1.
The effects of β4 on the mslo steady-state G-V relation vary with [Ca2+]. (A) Examples of currents evoked by voltage steps in 7 μM [Ca2+]. α alone is shown in the left panel, α+β4 is shown in the right panel. (B) Mean G-V relations at different [Ca2+] for α alone and α+β4. Each point represents mean data from 8 to 44 experiments. Solid curves represent fits to the Boltzmann function. (C) Mean V1/2 values plotted as a function of [Ca2+]. β4 shifts V1/2 toward more positive voltages <18.5 μM [Ca2+], and toward more negative voltages >18.5 μM [Ca2+]. Inset, α+β4 V1/2 subtracted from mean α alone values. (D) Mean effective gating charge, Q, plotted as a function of [Ca2+]. In the presence of β4 there is a decrease in Q, and a more dramatic increase in Q can be observed as [Ca2+] increases. (E) Mean Po as a function of voltage in the absence (5–7 patches) and presence (2–6 patches) of β4 in 300 nM Ca2+. Error bars represent SEM.

