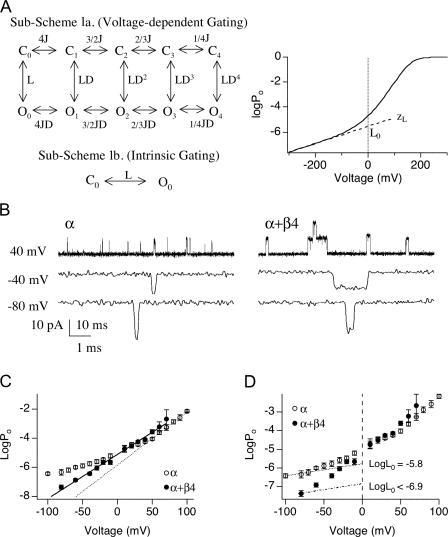
Figure 3.
β4 increases the intrinsic energetic barrier for channel to open. (A, left) According to the dual-allosteric mechanism (Horrigan and Aldrich, 1999, 2002), BK channel transitions between closed (C) and open (O) conformation is allosterically regulated by the state of four independent and identical voltage sensors. Sub-Scheme 1a represents BK channel's gating scheme at 0 Ca2+. Channel resides in either open or closed conformation, with 0–4 voltage sensors in the activated state. Equilibrium between C-O transitions is allosterically regulated by the states of the voltage sensors. Sub-Scheme 1b represents BK channel's gating scheme at 0 Ca2+ and very negative voltages. With all voltage sensors in the resting state, channel resides in one of two conformations, C0 and O0. Equilibrium between the C0–O0 transition is described by L, the intrinsic equilibrium for channel opening in the absence of Ca2+ and voltage sensor activation. (A, right) Illustration of how two components of L (L0 and zL) can be estimated by logPo-V data at 0 Ca2+ and negative voltages. Curve represents simulated logPo vs. voltage curve in nominally 0 Ca2+. Gating parameters used for simulation are as follows; L0 = 2.5 × 10⁻⁶, zL = 0.39 e0, zJ = 0.54 e0, Vhc = 173 mV, Vho = 25 mV. Dashed line represents fit for logPo-V at limiting slope using Eq. 4. L0 and zL can be derived from the fit. (B) Single-channel BK currents recorded in nominally 0 Ca2+ at indicated voltages. At −80 mV, α alone data was obtained from a patch containing ∼706 channels, and α+β4 data was obtained from a patch containing estimated ∼730 channels. At both −40 and +40 mV, α alone data was obtained from a patch with estimated ∼123 channels, and α+β4 data was obtained from a patch with estimated ∼411 channels. All traces were low-pass filtered at 3 kHz, except for α alone at −80 mV, which was filtered at 8.4 kHz. (C) Limiting slope is not reached for the logPo-V data in the presence of β4. Mean logPo as a function of voltage in the absence and presence of β4 in nominally 0 Ca2+ (3–12 patches for α and 4–11 patches for α+β4). Error bars represent SEM. The voltage dependence (slope) for α alone channels shows an apparent decrease at approximately +30 mV. For α+β4 channels, no apparent change in slope is observed over the voltage range between −80 and +70 mV. (D) β4 decreases L0 by at least 11-fold. Data from C replotted to show that estimates of L0 for α alone channels obtained by extrapolating logPo-V relations from limiting slope to 0 mV. An upper limit of L0 for α+β4 channels was estimated using Eq. 4, based on the mean Po value at −80 mV and a zL value of 0.3 e0.

