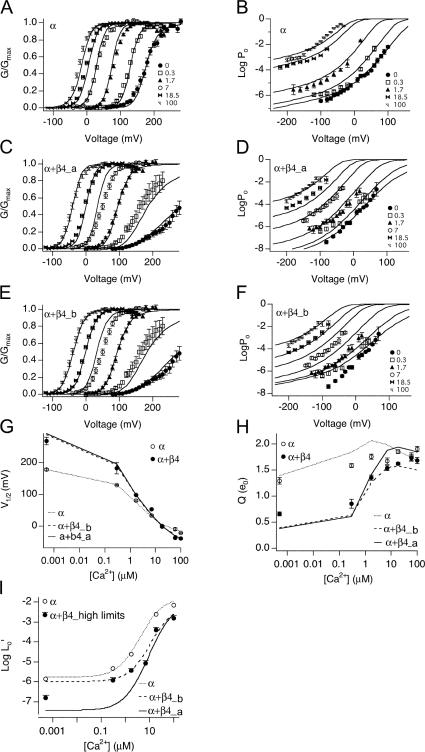
Figure 6.
Evaluation of fit parameters α, α+β4_a, and α+β4_b. Po-V relations at 0.0005, 0.3, 1.7, 7, 18.5 and 100 μM Ca2+ were simulated using indicated fit parameters (Table III) and fit to the Boltzmann function. (A and B) The fit from α is superimposed on a series of G-V data for α alone channels from macroscopic recordings, and Po-V data from single channel recordings, respectively. (C and D) The fit from α+β4_a (fit to G-V and low voltage Po-V relations) is superimposed on G-V and Po-V data for α+β4 channels, respectively. (E and F) The fit from α+β4_b (fit to G-V only) is superimposed on the same series of data as in C and D. (G) V1/2 vs. [Ca2+], (H) Q vs. [Ca2+], and (I) logL0′ vs. [Ca2+]. Simulations based on fit parameters (Table III) are compared with mean ± SEM of measurements (symbols).

