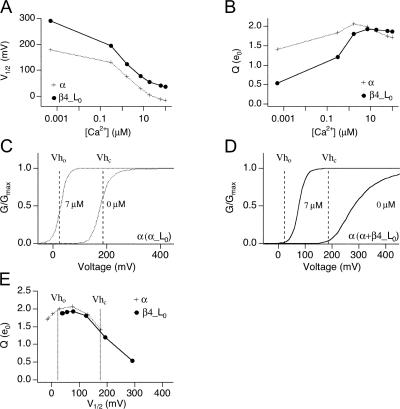
Figure 8.
Changes in G-V relations as a consequence of β4 modulation of L0. Simulations using α subunit parameters from Table III, with α L0 (plus symbols) or α+β4 L0 (closed symbols). (A) Effect of L0 modulation on V1/2 vs. [Ca2+] relationship, and (B) Q vs. [Ca2+] relationship. V1/2 and Q of simulated G-V were obtained from Boltzmann fit to simulated Po-V curves. (C–E) Illustration of how L0 and [Ca2+] affect Q by influencing position of G-V curves relative to Vho and Vhc. (C) Simulation of G-V curves in 7 μM (dashed line) and 0 calcium (solid line) relative to Vho and Vhc (vertical dash lines) using α subunit L0 parameter. (D) Same as C but using α+β4 L0 parameter. (E) Q vs. V1/2 relationships illustrates how position of V1/2 relative to Vho and Vhc affects Q values.

