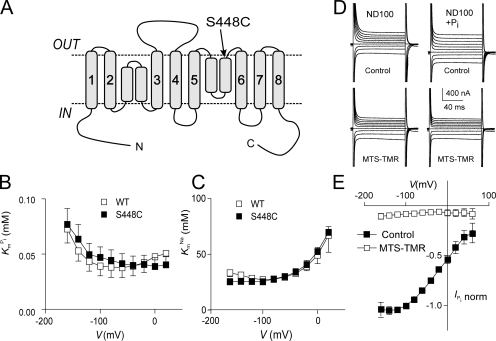
Figure 1.
Topology model and basic characterization of the S448C mutant. (A) Topology model predicting eight transmembrane segment and two reentrant loops, which dip into the membrane. N and C termini are intracellular. The site of the Ser-448-Cys mutation is indicated. (B) Voltage dependency of apparent affinity constant for Pi interaction ( ), determined at 100 mM Na+ for WT and S448C. Each data point is the mean ± SEM of the
  estimated from n = 4 oocytes. (C) Voltage dependency of the apparent affinity constant for Na+ interaction (K
m
Na), determined at 1 mM Pi for WT and S448C. Each data point is mean ± SEM of the K
m
Na estimated from n = 3 oocytes. (D) Original current traces obtained from an oocyte expressing S448C in response to voltage jumps between −120 and +60 mV from a holding potential of −60 mV in ND100 solution (left) or ND100 + 1 mM Pi (right). Upper traces were acquired before, and lower traces after the oocyte was exposed to MTS-TMR for 5 min. (E) Current–voltage relationship of S448C obtained by subtracting recordings similar to those shown in D before and after labeling with tetramethylrhodamine-methanethiosulfonate (MTS-TMR). Data points were normalized to
  at −100 mV (n = 4).

