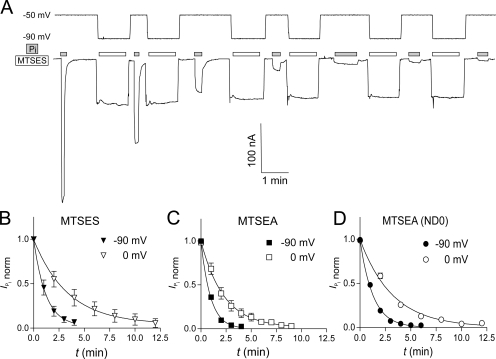
Figure 2.
Time course of modification of Cys-448 by MTS reagents. (A) Original voltage (top) and current (bottom) trace acquired from an oocyte expressing S448C and repeatedly exposed to 25 μM MTSEA for successive 1-min intervals (white bars). During MTSES exposure, the membrane potential was held at −90 mV. After washout of MTSES, the membrane potential was changed to −50 mV and 1 mM Pi was applied (gray bars) to record the Pi-induced current. (B–D)  , as a function of cumulative exposure time in MTSES (B), MTSEA (C), and MTSEA in the absence of Na+ (ND0 superfusate) (D). Abscissa is the cumulative exposure time (t) at the indicated incubation holding potential. In each panel,
  (at V
h = −50 mV) after each MTS exposure was normalized to
  at t = 0 and fitted with Eq. 3 (solid line) to obtain the effective second-order rate constant (see Table I).

