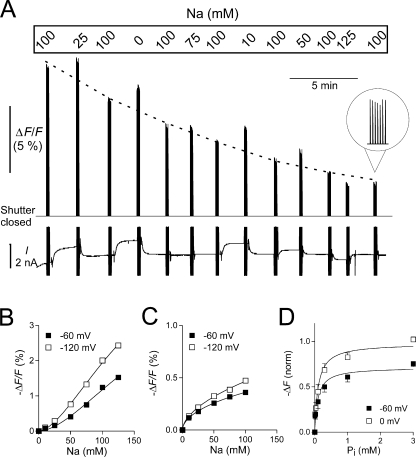
Figure 3.
Steady-state fluorescence measurements. (A) Original trace showing the fluorescence signal F and the holding current I recorded on the Minidigi 1A from an experiment in which the Na+ concentration was varied. The S448C-expressing and MTS-TMR–labeled oocyte was initially clamped at −60 mV and superfused with ND100 solution. After we equilibrated the oocyte with a new test solution, the shutter was opened periodically for seven successive 230-ms pulses followed by a 2-s closing time. To control for fluorescence rundown, each test solution was bracketed by ND100 solution. For better visualization of the rundown, the ND100 data is connected by a dotted line (drawn by eye). During the shutter opening, the membrane potential was stepped from −60 to −120 mV. These step changes in membrane potential are the cause of the capacitive current spikes visible in the current recording. Note the change in holding current as the Na+ concentration is changed. When the shutter is closed, F is outside the measurable range. (B) ΔF/F plotted as a function of Na+ for a representative oocyte, after correction for fluorescence rundown. Continuous lines are fits to data using the Hill equation. (C) ΔF/F plotted as a function of Li+ for a representative oocyte using a similar protocol as in A but with variable Li+ instead of Na+. Data were fitted with the Hill equation with H constrained to 1. (D) ΔF/F plotted as a function of Pi with Na+ constant at 100 mM. During the shutter opening time, the membrane potential was stepped from −60 to 0 mV. Data for individual oocytes were fit with the Hill equation (Eq. 1) with H constrained to 1, normalized to ΔF max at 0 mV, pooled, and refit with Eq. 1 (n = 5). See text for all fit parameters.

