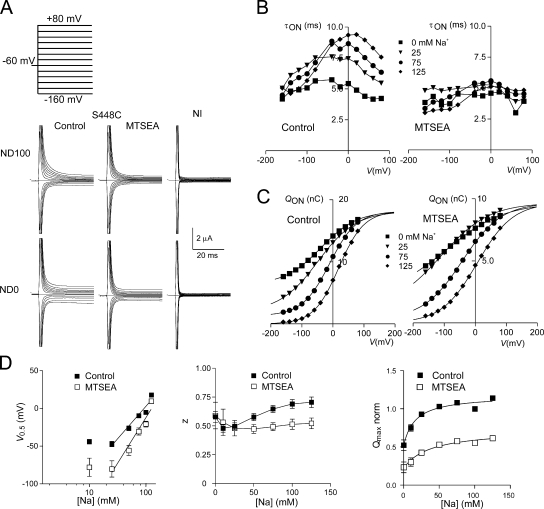
Figure 6.
Presteady-state charge movements associated with S448C before and after labeling. (A) Representative current recordings from the same oocyte before (left) and after (middle) labeling with 1 mM MTSEA for 3 min for superfusion in 100 mM Na+ (ND100) and 0 mM Na+ (ND0). Voltage steps were applied from V h = −60 mV to test potentials in the range −160 to +80 mV, as indicated. For comparison, currents from a noninjected oocyte (NI, right) from the same donor frog are also shown for the two superfusion conditions. (B) Voltage dependency of the main relaxation time constant (τON) as a function of the four Na+ concentrations indicated, before (left) and after (right) labeling for the S448C expressing oocyte in A. (C) Corresponding voltage dependency of the ON-charge (Q ON) associated with the main relaxation component plotted for four Na+ concentrations indicated before (left) and after (right) labeling. Continuous lines are fits with Eq. 2. The data were offset so that each curve superimposed at the depolarizing limit predicted for ND125, to better visualize the effect of Na+ on V 0.5. Note the difference in ordinate scales for the control and +MTSEA conditions. (D) Summary of the Na+ dependency of the Boltzmann fit parameters, V 0.5 (left), z (middle), and normalized Q max (right). Data points are shown as mean ± SEM (n = 4). The linear regression lines for the V 0.5 data were fit to data points for Na+ ≥ 25 mM. The Q max data were fit the modified Hill equation (Eq. 1) with a variable offset and H constrained to 1, and yielded Km Na = 16 ± 6 mM for control and 38 ± 14 mM for +MTSEA. For z, data points are joined for visualization only.

