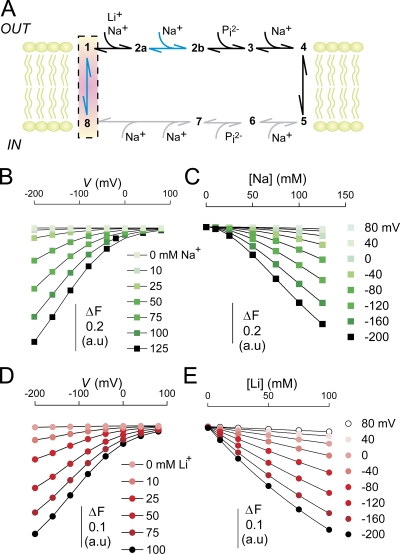
Figure 8.
Modeling the transport cycle of NaPi-II. (A) Kinetic scheme for the transport cycle of NaPi-II. Transitions that are influenced by voltage are indicated by blue arrows and include transition of the empty carrier (1⇔8) and the second Na+ binding (2a⇔2b). No information is available on the internal substrate interaction transitions, but they are depicted to mirror those taking place on the external side and are indicated with gray arrows. The highest fluorescence is associated with states 1 and 8, and is highlighted with a red box. (B) Simulated ΔF in response to membrane voltage and Na+ concentration. The points are joined for visualization only. (C) Data in B were replotted as a function of [Na]. The solid lines represent the fit Eq. 4. The Hill coefficient reported by the fit was 1.8 ± 0.01, in excellent agreement with experimental data. (D) Simulated ΔF in response to membrane voltage and Li+ concentration (data points joined for visualization only). Based on experimental data, we assumed that Li+ only interacts with the first Na+ binding step (1-2a). (E) Data in D were replotted as a function of [Li] and fitted with Eq. 4. The Hill coefficient reported by the fit was 1.0. The rate constants (in s−1) used in the simulations were as follows: k12a = 500[Na]o or k12a = 200[Li]o, k2a1 = 900(Na+ data) or k2a1 = 40 (Li+ data), k2a2b = 10,000[Na]oexp(αeV/2kT), k2b2a = 200exp(−αeV/2kT), k81 = 40exp(−γeV/2kT), k18 = 400exp(γeV/2kT). α and γ are the fractions of the electrical field that are sensed by the hypothetical charge moving through the membrane electrical field for transitions 2a⇔2b and 1⇔8, respectively, and were set to α = 0.13 and γ = 0.4. We assumed sharp, symmetrical energy barriers for the voltage-dependent transitions. Differential equations describing the rate of change of state occupancies (Xn) were solved for the state occupancies, where n is the state. The state occupancies were constrained such that X8 + X1 + X2a + X2b = 1, and the change in fluorescence was given by ΔF = 1 − (X2a + X2b). For the simulations, T = 293 K, [Na]o varied from 0 to 0.125 M, [Li]o varied from 0 to 0.1 M.

