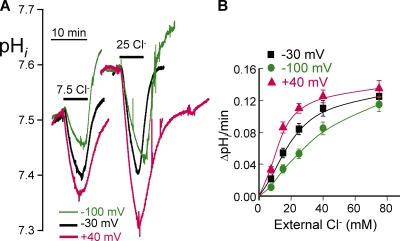
Figure 3.
Effect of the membrane potential on HCO3 − transport by slc26a3. The protocol shown in Fig. 2 C was used to measure changes in pHi except that the changes in pHi at each Clo − concentration were measured while holding the membrane potential alternately at −30, −100, and 40 mV. The membrane potential was clamped after the stabilization of Cli − and for 30 s before and during the duration of the subsequent measurement of Cl−/HCO3 − exchange. No more that three Cl− concentrations were tested in each oocyte to minimize error caused by the deterioration of the signal. (A) Example traces from the same oocyte exposed to 7.5 and 25 mM Clo − while holding the membrane potential at −30 (black traces), −100 (green traces), or 40 mV (red traces). Results from at least three measurements at each Cl− concentration and at the indicated membrane potentials, similar to those in Fig. 3 A, are plotted in B and show the Clo −-dependence of HCO3 − transport at −30 (squares), −100 (circles), and 40 mV (triangles). Error bars represent SEM.

