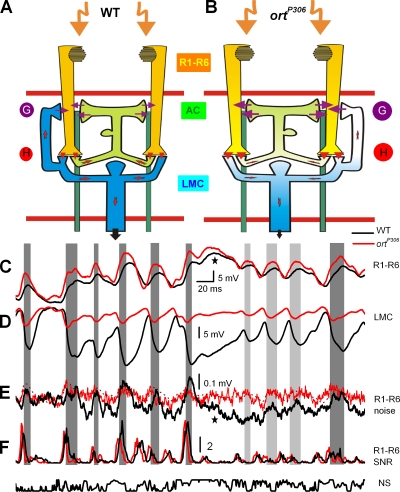
Figure 7.
Conceptual feedback model of synaptic transmission within a neuro-ommatidium highlighting the dominant synaptic connections and neural signaling during NS. Feedback from interneurons (AC, green; LMC, blue) to photoreceptors (R1–R6, yellow) in (A) WT and (B) ortP306. Interneurons connect with all six photoreceptors; for clarity only R1 and R2 photoreceptors are shown. Arrows indicate the flow of information. The whiter the cells the more depolarized they are. Transmitters: G, glutamate (Sinakevitch and Strausfeld, 2004); H, histamine (Hardie, 1989a). Response properties of photoreceptors and LMCs: WT (black), ortP306 (red). Cells were dark adapted for 30 s before stimulation. Typical in vivo signals (average responses to 30–150 stimulus sweeps) of (C) photoreceptors, (D) LMCs, and (E) photoreceptor noise SD (mean of four cells) and (F) SNR(t)s to bright NS. In E, the dotted line compares noise SD of ortP306 photoreceptors to a rescaled and inverted voltage trace of an ortP306 LMC (from D). Gray bars indicate moments in responses of WT LMC from their highest rate of change to troughing.

