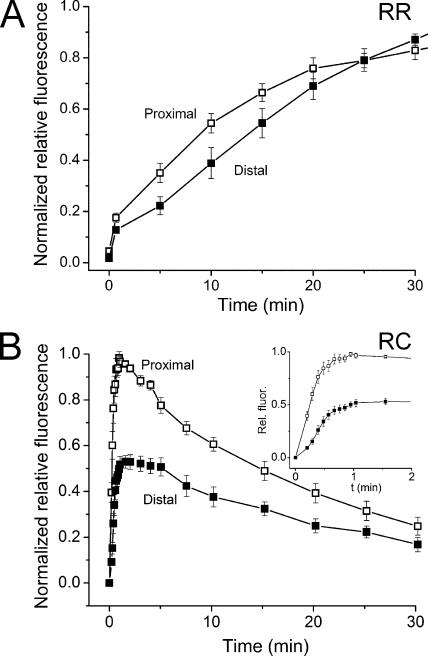
Figure 2.
Time course of the average normalized fluorescence change (mean ± SEM) in two different outer segment regions of intact isolated salamander red rods (n = 7, A) and red-sensitive cones (n = 6, B): proximal OS (□), distal OS (▪). (B, inset) Same data as in main panel plotted on expanded time scale. Data are normalized relative to the peak value.

