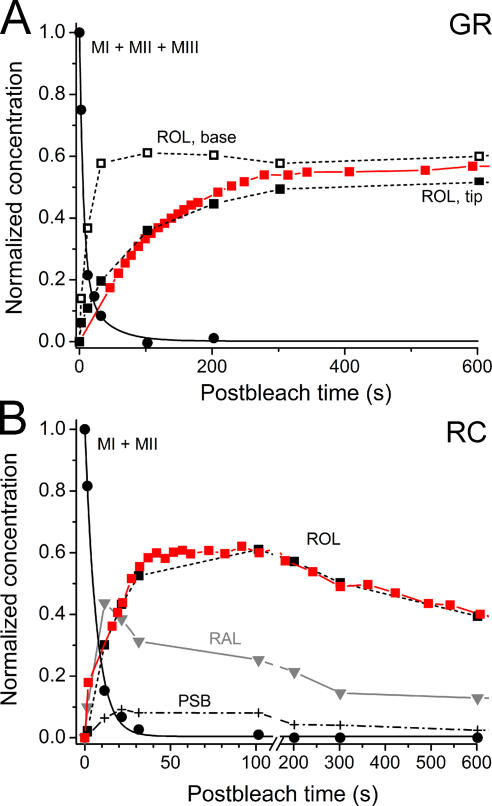
Figure 4.
Time course of metapigment decay and retinal and retinol concentration changes in salamander green rods (GR) and red-sensitive cones (RC). Filled circles fitted by black continuous line in A and B illustrate metapigment decay. Parameters of the fits are given in Table II. (A) Black dashed line through black squares, time course of retinol (ROL) as assessed with MSP (filled squares, tip of the OS; empty squares, base). Data on meta decay are average of three isolated OSs and two intact cells; retinol time course deduced from MSP data is based on two intact cells. The retinol time course averaged over entire OS as assessed by microfluorometry (average of seven cells) is shown by red squares. The time courses of retinal and PSB are omitted for clarity. (B) Gray line through inverted triangles shows RAL. Dot-dashed line through crosses, PSB. Average of seven cells. Red line through filled red squares, average time course of retinol (ROL) as assessed with microfluorometry and scaled for the best match to ROL data assessed by MSP. Error bars omitted for clarity.

