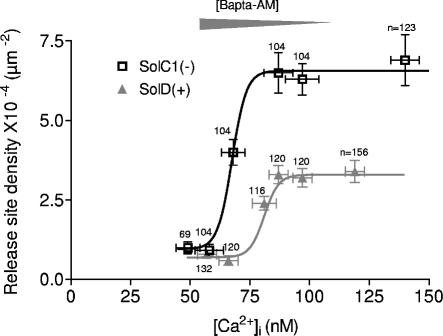
Figure 5.
Release site density as a function of intracellular calcium concentration. The number of calcium release sites was determined using confocal microscopy in SolC1(−) and SolD(+) myotubes incubated with fluo-4-AM and different concentrations of BAPTA-AM. Intracellular calcium concentrations were also determined in SolC1(−) and SolD(+) myotubes, in the same BAPTA-AM conditions using cytofluorimetry technique and the Ca2+ probe Indo-1. Then, RSD obtained for each BAPTA concentration was reported as a function of the intracellular calcium concentration in SolC1(−) (squares) and SolD(+) (triangles) myotubes. For each point, the number of myotubes analyzed is given near the symbol. BAPTA-AM concentrations were 100 nM, 300 nM, 1 μM, 3 μM, and 10 μM incubated for 20 min, as illustrated by a large gray arrowhead on the graph. Data were fitted using Boltzmann equation (black and gray lines).

