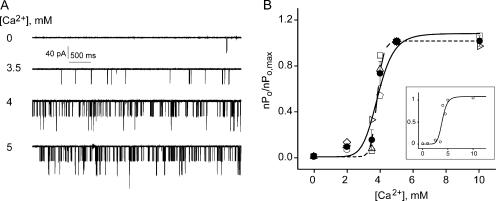
Figure 3.
MthK is sharply activated by Ca2+ in the millimolar range. (A) Representative single-channel traces at 0, 3.5, 4, and 5 mM Ca2+. (B) Ca2+ dose–response of MthK. Each open symbol is a single bilayer, with 11 different bilayers analyzed. Filled symbols represent mean ± SEM from three separate bilayers with the exception of the 10 mM Ca2+ point with n = 2. Data points were fit with the Hill equation (Eq. 3) with n = 8 (smooth line, Kd = 3.8 ± 0.2 mM, and ra,max = 1.07 ± 0.1) and n = 20 (dashed line, Kd = 3.8 ± 0.04 mM, and ra,max = 1.00 ± 0.04). Inset shows a Ca2+ dose–response from a single representative bilayer. The data (open circles) were fit with the Hill equation with n = 8 (Kd = 3.9 ± 0.14 mM, and ra,max = 1.08 ± 0.14). The axes are the same as in B.

