Figure 5.
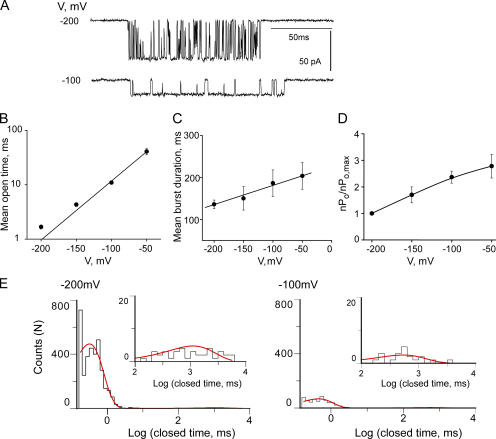
MthK displays voltage-dependent gating. (A) Representative single channel traces with 5 mM Ca2+ at −100 and −200 mV. The open dwell time (B), burst duration (C), and relative activity (D) plotted from −200 to −50 mV. Symbols represent mean ± SEM from 10 separate bilayers for the values in B and C and three bilayers for D. Data points in B were fit with Eq. 5 (straight line) to determine the voltage dependence (zo = 0.62 ± 0.04, n = 10) of the open durations within a burst. (E) Closed dwell time histograms from a representative bilayer at −200 and −100 mV fit with a sum of two exponentials (Materials and Methods). The fitted time constants and areas are: A1 = 0.96 ± 0.14, τ1 = 0.52 ± 0.11, A2 = 0.04 ± 0.02, and τ2 = 636 ± 3 for −100 mV, and A1 = 0.99 ± 0.06, τ1 = 0.36 ± 0.15, A2 = 0.01 ± 0.045, and τ2 = 1293 ± 11 for −200 mV. Insets show magnification of histogram data for closures ≥100 ms; smooth line is the exponential fit.

