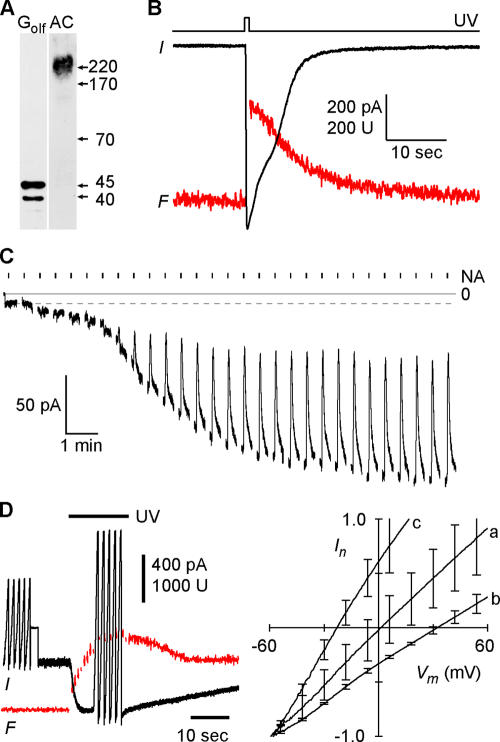
Figure 1.
Ca-activated Cl currents in Odora cells. (A) Western blot of Odora cell membrane proteins showing expression of adenylyl cyclase type III (AC) and the olfactory GTP binding protein Golf. (B) Simultaneous recording of whole-cell current (black trace) and Ca-dependent fluorescence (red trace) during flash-induced photorelease of Ca. The flash duration was 500 ms, Vm was −40 mV. (C) Sensitivity of the Ca-induced current to niflumic acid (NA). Whole-cell recording of an Odora cell during dialysis of the cytosol with a solution containing 3.5 μM free Ca and 140 mM CsCl. Immediately after breakthrough, the holding voltage was switched to −40 mV. The resulting leak current was about −9 pA (dashed line). As Ca diffused into the cell, the Cl current developed over 10 min up to a maximal amplitude of −160 pA. A 2-s pulse of 20 μM NA was delivered every 40 s. NA did not affect the leak current (first five pulses), but blocked 70% of the Ca-induced current. (D) To obtain I-Vm relations for the Ca-dependent channels, whole-cell currents were recorded during five voltage ramps (−60 to +60 mV) before and after photolysis of caged Ca. The averaged I-Vm relations recorded before illumination were subtracted from the I-Vm relations recorded during the maximal Ca signal. The resulting curves were normalized to their current values at −60 mV and superposed for symmetrical Cl concentrations (a, 140 mM Cl outside), for an outward-directed Cl gradient (b, 50 mM Cl outside), and for biionic conditions (c, 140 mM iodide outside). The pipette solution contained 145 mM Cl. This experiment demonstrates that the Ca-induced current is a Cl current and that the relative iodide permeability PI/PCl of the Ca-activated Cl channels is 3.

