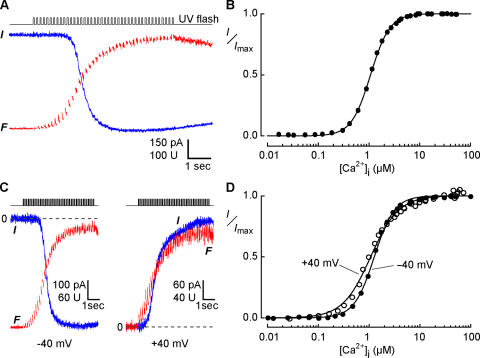
Figure 4.
Determination of the Ca sensitivity of Cl channels in an Odora cell. (A) Simultaneous current (blue trace) and fluorescence (red trace) recordings at −40 mV during incremental photolysis of caged Ca in an Odora cell. A series of 42 flashes (50 ms) with reduced light intensity caused a stepwise increase of the cytosolic Ca concentration that saturated both the Cl channels and the Ca-sensitive dye. (B) Dose–response relation for the activation of Cl channels obtained from the data in A. The Ca concentration for half-maximal activation K1/2 was 1.07 μM, with a Hill coefficient of 2.3. (C) Examination of the effect of membrane voltage on Ca sensitivity. The same protocol as in A was applied at −40 mV (left) and at + 40 mV (right). The inward current at −40 mV was generated by Cl efflux, the outward current at +40 mV by Cl influx. The dashed line indicates zero current. (D) Dose–response relation obtained from the data in C, yielding K1/2 and n values of 1.27 μM and 2.19 for −40 mV, and 1.07 μM and 1.58 for +40 mV, respectively.

