Figure 2.
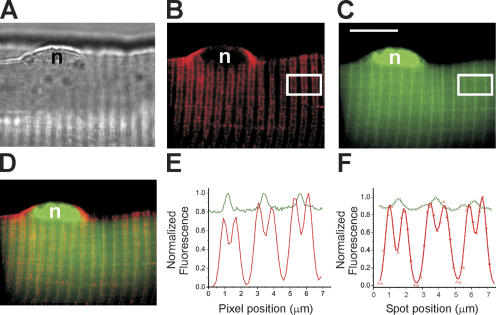
TPLSM imaging and TPSpD of fluorescence from double stained mouse FDB skeletal muscle fiber. (A) Bright field image of a segment of an FDB skeletal muscle fiber. (B) TPLSM pseudocolor image of di-8-ANEPPS fluorescence in the same fiber as in A. The image was acquired 40 min after the fiber was impaled with the microelectrodes. Two-photon excitation wavelength was 940 nm and the fluorescence selected with a 568–618 nm bandpass filter. (C) TPLSM pseudocolor image of the same fiber as in A showing the distribution of the Ca2+ indicator OGB-5N. Two-photon excitation wavelength was 820 nm and the fluorescence selected with a 515–545-nm bandpass filter. The plane of focus was the same for images A–C. Images were 487 × 388 pixels. Acquisition time for fluorescence images was 3.6 s. The white calibration bar represents 10 μm and applies for images A–D. The images in B and C were processed to yield optimal contrast by adjusting the background intensity level (outside the muscle fiber) to zero and the maximal intensity (saturation) to 255. The pseudocolor rendition assigned 256 intensity levels of red for image (B) and of green for image C. (D) Superposition of images in B and C. The letter n in A–D denotes a nucleus of the muscle fiber. (E) Normalized fluorescence intensity profiles averaged in a region of interest and plotted as a function of the longitudinal pixel position. The red trace was obtained from the white box in B (di-8-ANEPPS distribution) and the green trace was obtained from the white box in C (OGB-5N distribution). The intensities were normalized to the maximum value within each box. (F) Normalized fluorescence intensity profiles obtained in the same fiber as in A–D, but using TPSpD in 200-nm steps. The red symbols (di-8-ANEPPS) correspond to position-dependent fluorescence intensities (integrated during 100-μs illumination periods) when the fiber was illuminated with a two-photon excitation wavelength of 940 nm and the fluorescence filtered through a 568–618-nm bandpass. The green symbols (OGB-5N) correspond to position-dependent fluorescence intensities (integrated during 35-ms illumination periods) excited at 820 nm and the fluorescence selected with a 515–545 bandpass filter. The interval between consecutive step advances was 5 s. The data for OGB-5N was corrected for 3% crosstalk from di-8-ANEPPS fluorescence observed at the lower excitation wavelength. The data for di-8-ANEPPS did not require correction. Both the OGB-5N and di-8-ANEPPS traces represent Gaussian fits to the data, and are shown normalized with respect to the maximum value obtained for each indicator. The [EGTA] was 10 mM.

