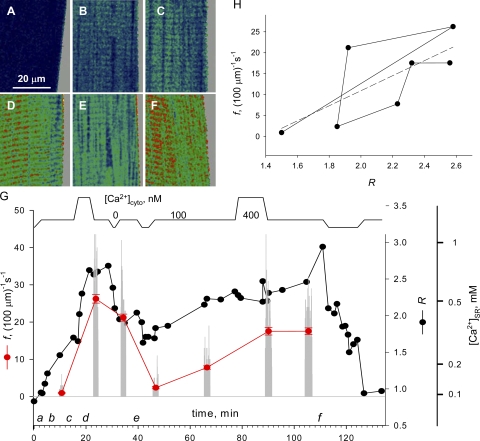
Figure 2.
Interventions that change [Ca2+]SR. (A–F) Representative SEER ratio images of fluorescence of mag-indo-1 trapped inside organelles of a membrane-permeabilized muscle fiber. (G, top) Schematic representation of [Ca2+] in perfusing solutions, including the reference (100 nM), a high Ca2+ saline (400 nM) and relaxing solution (∼10 nM). Black symbols and lines plot R, SEER ratio averaged over well-stained regions of the image. Gray bars, the frequency of sparks detected in individual line scan images. Red symbols, f, average spark frequency (±SEM) within series of 50 line scan images. Right offset axis, [Ca2+] corresponding to R. Identifier: 061004a.

