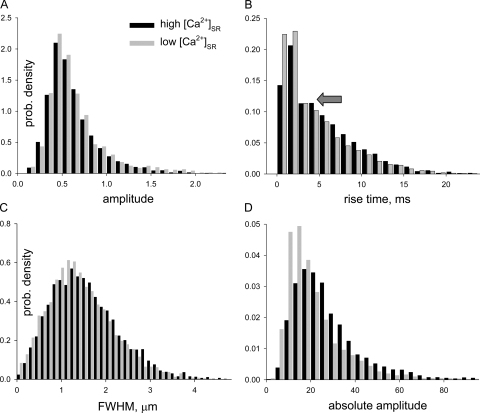
Figure 5.
Effects of [Ca2+]SR on morphologic spark parameters. Histograms of parameter values of individual sparks in all fibers included in Table II. Black bars represent the high [Ca2+]SR condition and gray bars the low [Ca2+]SR condition. (A) Histogram of conventionally defined amplitudes. (B) Histogram of rise times. The arrow marks a minor mode, visible in this histogram in both conditions. (C) Histogram of FWHM. (D) Histogram of absolute amplitudes, calculated as described in Materials and Methods. Note that the histogram of absolute amplitudes changes with [Ca2+]SR, whereas that of conventionally defined amplitudes does not.

