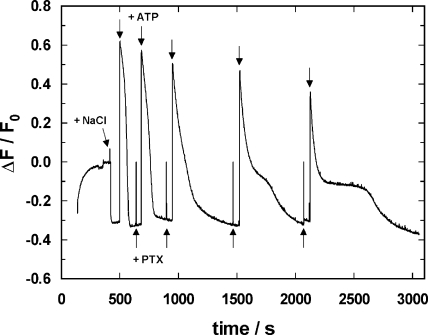
Figure 3.
Effect of PTX on the P-E2 state of the Na,K-ATPase. After the Na,K-ATPase was equilibrated in standard buffer at 20°C, the fluorescence level, F0, represents the state H2E1. Addition of NaCl (50 mM) induced the transition to Na3E1 and the subsequent addition of ATP (1 μM) led to enzyme phosphorylation, transition into the P-E2 conformation, and release of the Na+ ions bound. Due to the fact that the amount of ATP present was so small, within ∼100 s, all ATP was hydrolyzed and all pumps returned into the equilibrium state, Na3E1, under this buffer condition. Then 50 nM PTX was added as well as another 1 μM ATP. In the presence of PTX, the time course of the fluorescence signal was slightly modified. Repetitive additions of 50 nM PTX and 1 μM ATP up to a final PTX concentration of 200 nM led to a distinct fluorescence pattern with an intermediate fluorescence level, which corresponded approximately to the level of the ion pump with two monovalent cations bound. After each reaction sequence, however, the final equilibrium state was Na3E1.

