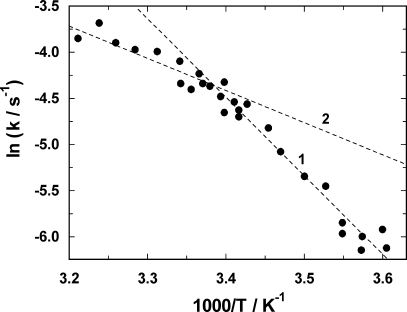
Figure 5.
Temperature dependence of the PTX-induced transition from P-E2 into the toxin-modified state. The fluorescence decrease upon PTX addition was measured at various temperatures between 5°C and 38°C, and fitted by a single exponential function, ΔF·exp(−kt). The rate constant, k, was plotted against the temperature in form of an Arrhenius plot. The data show different temperature dependences below and above 23°C (1/T = 3.378 × 10⁻³ K−1). The dashed lines through the data represent (1) 71 kJ/mol and (2) 28.5 kJ/mol.

