Figure 2.
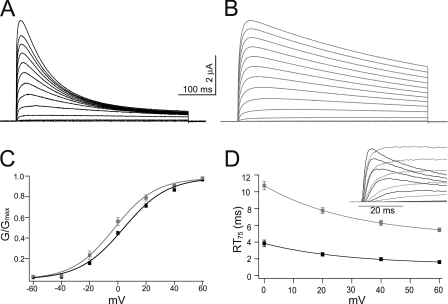
Activation of mKv1.7 channels. Representative outward currents in response to 500-ms depolarizing test potentials ranging from −60 to +80 mV in 10-mV increments, extracellular solution NFR, Vh= −100 mV. mKv1.7L is shown in black (A) and mKv1.7S in gray (B). (C) Steady-state activation curves for mKv1.7L (n = 20, black) and mKv1.7S (n = 15, gray). Mean ± SEM of the relative conductances are plotted against the potential. The smooth line corresponds to Boltzmann fits to the data. (D) Rise time plot of mKv1.7L (n = 13) and mKv1.7S (n = 20) currents measured as the time in ms required for reaching 75% of Imax (RT75) from on-cell patch clamp experiments. mKv1.7L data are shown in black and mKv1.7S in gray. The inset in D presents superimposed early current traces of on-cell patch clamp recordings of mKv1.7L and mKv1.7S channels.

