Figure 10.
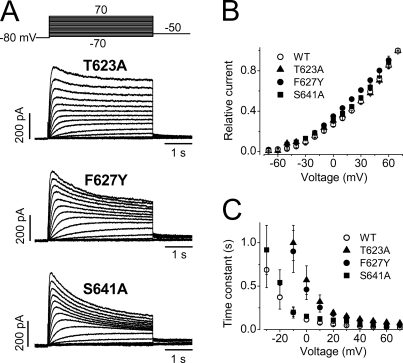
Na+ currents recorded from the T623A, F627Y, and S641A mutant hERG channels. (A) Families of Na+ currents from T623A, F627Y, and S641A. (B) The relative current–voltage relationships of Na+ currents recorded from WT, T623A, F627Y, and S641A channels (n = 5–9 cells). (C) The activation time constant–voltage relationships of the T623A, F627Y, and S641A Na+ currents (n = 5–9 cells), data for WT channels were also shown for comparison (n = 13).

