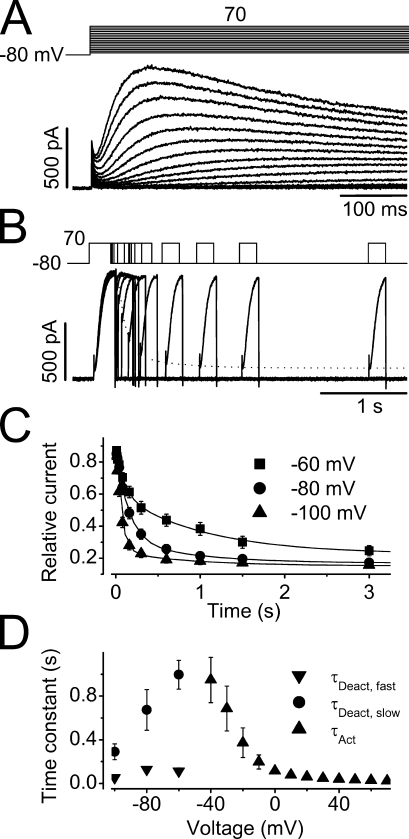
Figure 3.
Time courses of hERG Na+ current activation and deactivation. (A) The initial phase of the Na+ currents during the depolarizing pulses ranging from −70 to 70 mV in 10-mV increments. The activation time constants were estimated by fitting the rising phase of each current trace to a single exponential function with the initial sigmoidal component ignored (n = 13). (B) A three-pulse protocol was used to study the hERG Na+ current deactivation. After a peak current was reached by the initial depolarizing pulse to 70 mV (P1), the cell was clamped to −80 mV (P2) for different periods of time before it was depolarized to 70 mV (P3) to monitor the channel deactivation. The dotted line indicates the double exponential fit to the instantaneous current amplitudes upon P3. (C) The amplitude of the initial current during P3 was plotted against the time periods of P2 at −60, −80, and −100 mV, fitted to double exponential functions to obtain time constants of deactivation at −60 (▪), −80 (•), and −100 mV (▴) (n = 7). (D) Voltage dependence of the time constants of activation (▴), and fast (▾) and slow (•) components of deactivation.

