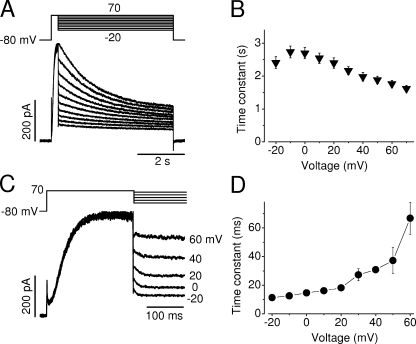
Figure 4.
Voltage-dependent fast and slow decay of the hERG Na+ current. (A) Cells were held at −80 mV and depolarized to 70 mV for 250 ms to induce the maximal hERG Na+ currents. Test pulses were followed at potentials ranging from −20 to 70 mV in 10-mV increments. Current decays during 5-s test pulses were fitted to a single exponential function to obtain the time constants. (B) Voltage dependence of the averaged slow decay time constants from nine cells. (C) hERG Na+ current during the voltage changes from 70 mV to various test potentials. hERG Na+ current was evoked by a depolarizing step to 70 mV for 250 ms, immediately followed by test potentials between −20 and 60 mV. The rapid decay of the Na+ current upon various test potentials was fitted to a single exponential function to obtain time constants. (D) The voltage dependence of the time constants of the rapid Na+ current decay (n = 6 cells for each voltage). hERG currents were recorded with a pipette solution containing 135 mM Na+ and a bath solution containing 135 mM NMG+.

