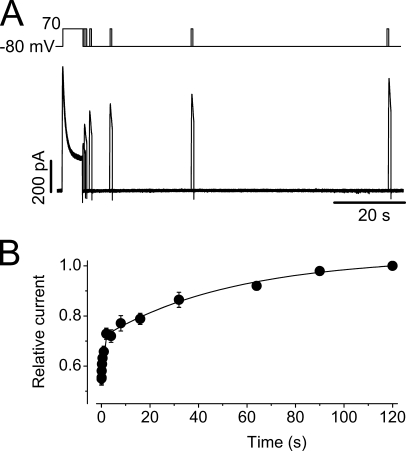
Figure 5.
Time course of recovery from inactivation of the hERG Na+ current. (A) Voltage protocol and the Na+ currents for studying recovery from inactivation. From a holding potential of −80 mV, the cell was depolarized to 70 mV for 6 s until steady-state inactivation was reached. The cell was then clamped to −80 mV for different periods of time before it was depolarized to 70 mV for 800 ms to observe channel recovery. The interpulse interval was 120 s. (B) Time-dependent recovery of the Na+ current. The superimposed line represents the best fit of the averaged data from 13 cells to double exponential functions.

