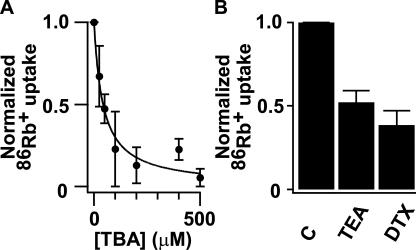
Figure 3.
Block of KvLm-evoked 86Rb+ uptake by TBA, TEA, and DTX. (A) Dose–response curve for TBA-block measured at 20 min. Solid line depicts the fit to normalized 86Rb+ uptake = (1 + [TBA]/K d)−1 with a K d = 43 ± 6 μM (K d ± SD). (B) Bars represent uptake at 20 min in presence of 10 mM TEA, and 500 nM DTX relative to control (C).

