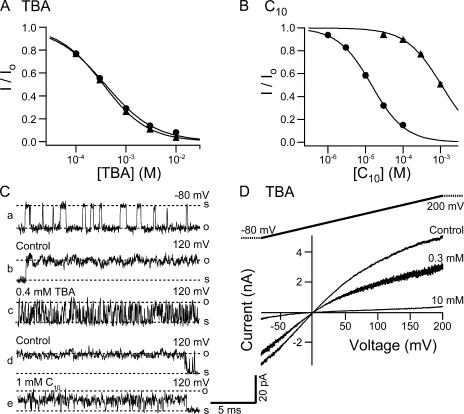
Figure 11.
TBA and C10 affinities are differentially affected in the S6/2-KcsA mutant. (A) Dose–response curves for TBA block of the S6/2-KcsA mutant (solid triangles) and wild-type BK channels (solid circles). Remaining fractions of steady-state currents at 120 mV in the presence of different concentrations of TBA were determined from five patches for the S6/2-KcsA channels. Wild-type dose–response is the same as shown in Fig. 9 A. The average values and SEM are plotted as functions of TBA concentration. Smooth lines are fitting curves with Hill equation: I/Io= 1/(1 + ([TBA]/Kd)n). Values used in the fitting are Kd = 0.35 mM, n = 0.97 (mutant) and Kd = 0.38 mM, n = 0.87 (wild type). (B) Dose–response curves for C10 block of the S6/2-KcsA mutant (solid triangles) and wild-type BK channels (solid circles). Remaining fractions of steady-state currents at 100 mV in the presence of different concentrations of C10 were determined from five patches for the S6/2-KcsA channels. Dose–response for wild-type BK channels is the same as shown in Fig. 9 B. The average values and SEM are plotted as functions of C10 concentration. Smooth lines are fitting curves of the data with Hill equation: I/Io= 1/(1 + ([C10]/Kd)n). Values used in the fitting are Kd = 1.06 mM, n = 0.95 (S6/2-KcsA) and Kd = 14.5 μM, n = 0.97 (wild type). (C) Single channel recordings of the S6/2-KcsA channels. a, b, and c are from one patch, d and e from another, at shown membrane potentials. (D) Macroscopic currents were recorded from an inside-out patch expressing the S6/2-KcsA mutant channels in response to a 200-ms voltage ramp from −80 to 200 mV. Shown traces are in the absence (control) and presence of 0.3 and 10 mM TBA. Currents are not leak subtracted.

