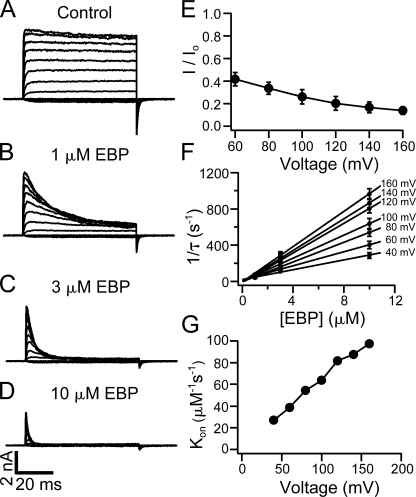
Figure 4.
Voltage and concentration dependence in the block of BK channels by EBP. Macroscopic BK currents were recorded in response to depolarizations of membrane potential from −80 to 160 mV at 20-mV steps. Current families are shown in the absence (A) and presence of 1 μM EBP (B), 3 μM EBP (C), and 10 μM EBP (D). (E) Remaining fractions of currents in the presence of 1 μM EBP (compared with control) at the end of 60-ms pulses at positive potentials were measured from six patches, and the average and SEM are plotted as a function of membrane potential. Error bars representing SEM in this and other figures are often smaller than the symbols. Note in B that currents may not reach steady state within 60 ms at all potentials in the presence of 1 μM EBP. (F) EBP block is fitted with single exponential time course at positive potentials in the presence of 1, 3, and 10 μM EBP from six patches. The reciprocals of the time constant (1/τ) are averaged and plotted as a function of EBP concentration with error bars representing SEM. The relations between 1/τ and EBP concentration are fitted with straight lines at each potential. (G) Kon values measured by the slope of the fitted lines in F are plotted as a function of membrane potential. The solid lines connecting the data points in E and G have no physical meaning.

