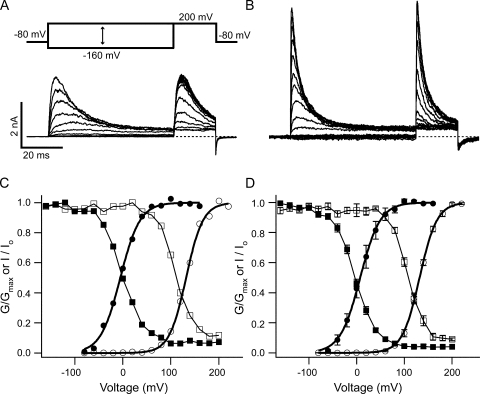
Figure 8.
Block of BK channels by EBP is dependent on the open probability. Macroscopic BK currents in the presence of 3 μM EBP were recorded using the shown voltage protocol. From a holding potential at −80 mV, membrane potential was stepped to a value between −160 and 200 mV at 20-mV steps for 60 ms, followed by a 20-ms test pulse at 200 mV. Currents shown in A and B are from the same patch with different Ca2+ concentrations. Low Ca2+ solution was used in A and High Ca2+ in B. (C) From the same patch shown in A and B, the relative conductance of macroscopic BK channels as a function of membrane potential was determined in the absence of EBP by isochronal tail current amplitude at −80 mV with Low (open circles) or High Ca2+ solution (solid circles). Both sets of data were fitted with the Boltzmann function G = Gmax/(1 + exp(−zF(V − V1/2)/RT)) (smooth lines) and then normalized to the maximum of the fit. In this function, V1/2 is the membrane potential at which half of the channels are open, and z is the apparent equivalent gating charge, while all other parameters have their normal meanings. Values used for the fitting are V1/2 = 131.8 mV, z = 1.46 (Low Ca2+) and V1/2 = –5.1 mV, z = 1.25 (High Ca2+). Relative peak current amplitudes (I/Io, Io is the maximal peak amplitude in the presence of EBP) during the test pulse in A and B are shown together with the Po-V curves as functions of the prepulse membrane potential for Low Ca2+ (open squares) and High Ca2+ (solid squares). Lines connecting the squares have no physical meaning. (D) Same experiments described in A–C were repeated on three other patches. The average of the four patches is plotted with SEM. Values used to fit the Po-V relations (smooth lines) are V1/2 = 131.9 mV, z = 1.41 (Low Ca2+) and V1/2 = 7.0 mV, z = 1.22 (High Ca2+).

