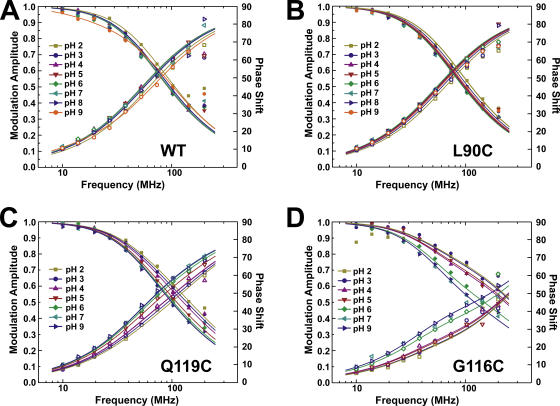
Figure 3.
Lifetime measurements of KcsA mutants at different pH (N = 3). (A) KcsA-WT (background fluorescence), (B) KcsA-L90C, (C) KcsA-Q119C, and (D) KcsA-G116C. KcsA-WT and –L90C could be fitted with a single lifetime model, KcsA-Q119C and -G116C had to be fitted to a double lifetime model (see Materials and methods for details). Shown are the data (symbols) as well as the fits (lines). For each given pH, the modulation amplitude (decreasing) and phase shift (increasing) are shown.

