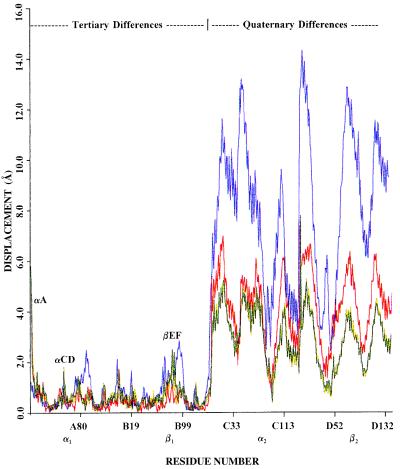
Figure 3.
Coordinate difference plot (CDP) showing the differences between corresponding Cα atoms of deoxyhemoglobin (blue), COHbA (red), α2β82CA82β (yellow), and α2β82ND82β (green) after their α1β1 interfaces have been superimposed onto that of R2 hemoglobin as described in Fig. 2. The ordinate indicates the displacement of the corresponding Cα atoms, and the abscissa shows the residue number where the A:B dimer corresponds to α1β1 and the C:D dimer corresponds to α2β2. The region labeled tertiary differences (α1β1) corresponds to structural alterations between tertiary elements, such as slight helical displacements. The largest structural difference is confined to the first few residues of the A helix of the α subunit (labeled αA), which, in the R, α2β82CA82β, and α2β82ND82β structures, are identical (see Fig. 2). The region labeled quaternary differences (α2β2) visualizes the large quaternary rotational differences between these structures. From this plot, it is clear that the structures of α2β82CA82β and α2β82ND82β lie directly between those of the R and R2 liganded structures.

